Analysis: All hope lost for Cardano (ADA)
I keep writing about Cardano, even though the price does little. It is waiting and waiting, while the price keeps falling. Bitcoin has fallen from 69,000 to 60,000, and as always altcoins fell much faster. When will the time finally come that altcoins will flourish, regardless of what Bitcoin does? Most people who hoped for that have lost courage by now. Fear is returning to the market, and as annoying as it sounds for the bears: those are precisely buying opportunities. No, Cardano is not going to 10 cents, and not to 20 either.
What do you base this on?
I think it would be good to start with a short-term chart. Slowly but surely we see a bottom formation on the chart below. Keep in mind that this is an hourly chart, so it is still very early. Still, I see a double bottom and cautious higher lows. Well, and that is just a setup for an upward movement.
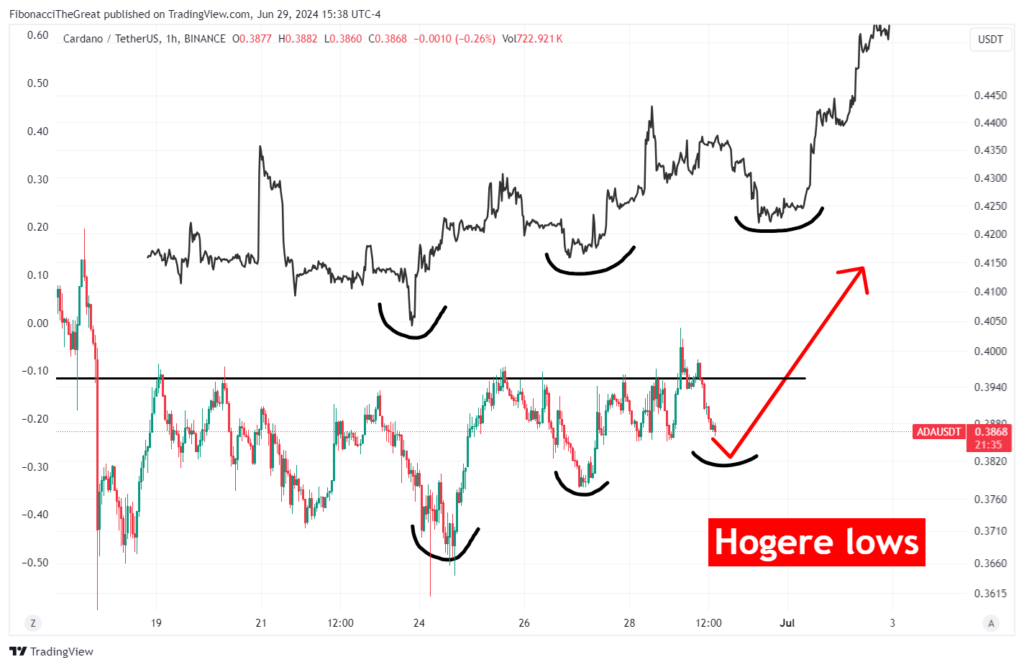
This move will only hold if we actually make a higher low now, as can be seen in the black price movements. For those who don’t immediately recognize this price data: this is the Bitcoin price in September 2023. I saw some similarities and put it on the chart to illustrate what I want to see with Cardano in the coming days. This is the ideal scenario I have in mind. The invalidation point is below $0.38. That would mean a lower low and invalidate the upward move.
Now we have only discussed the short term chart, but there are also some positive signals on the longer term charts. Below I will discuss the daily chart.
A falling wedge as the icing on the cake
Although the positive signals are still early, they are certainly present. We also see something special on the daily chart: a falling wedge, or in other words, a falling wedge.
Well, what do you imagine about that? It is a bullish pattern, let me start with that, consisting of lower lows and lower highs that push the price into a point. A kind of falling triangle. The price often breaks out in an upward direction.
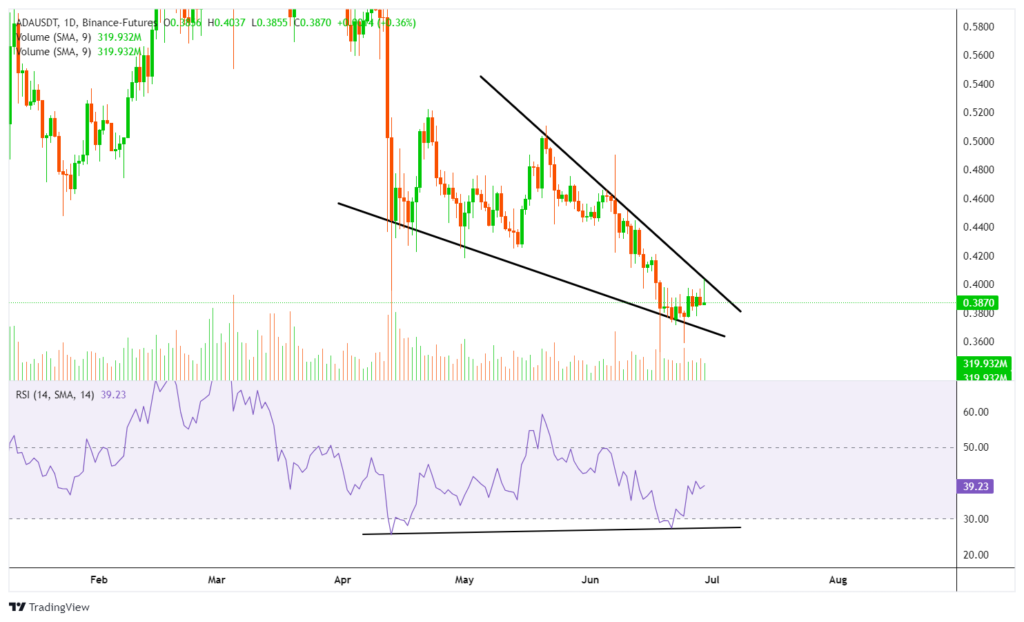
We always look for confirmation of a possible bullish scenario, and I find that in the RSI, the Relative Strength Index. This is an indicator that shows the strength of the trend. While the price of Cardano has made a clear new low, the RSI has made a higher low (see the black line). This is called a bullish divergence, which often predicts a bullish trend.
Conclusion
Let’s summarize everything: in the short term we see cautious steps in the right direction and an upward movement seems to be forming. On the daily chart we see a bullish pattern, namely a falling wedge, which is confirmed by the divergence with the RSI.
It may take a while, but realize that Cardano, although slow, is changing its trend. Hope is not lost yet. Are you ready for the green candles?